
Introduction
Cannabis, also known as marijuana, is a complex emerging industry in the Western US. For decades, cannabis was grown illegally in the shadows, but now as legalization expands across the US, production of the crop has ballooned and shifted. With the development of this industry has come concerns about where and how it is grown, and its potential effects on the environment. For the first time, an opportunity is emerging for communities to openly discuss what cannabis means to them, their local economies, and the environment. A key piece of this discussion is where cannabis should be grown. This website visualizes cannabis landscapes on private land from 2016 (the first growing season after recreational legalization) in Josephine County, Oregon.
Josephine County
A shifting industry
“It was a special thing, that you are flaunting society’s mores by consuming something you know full well you shouldn’t be, or the illegal possession is part of being rebellious” – Legacy cannabis farmer, Josephine County, Oregon
Josephine County is in Southern Oregon. Use the map to explore the region (you can zoom in and out, move around, and expand or close the legend). When you’re ready to move on, keep scrolling down in this dialog box.
Oregon, and Josephine County in particular, has a long history of cannabis cultivation…
Cannabis in the 1960s
The modern cannabis movement in Southern Oregon traces its roots to counterculture back-to-the-land and Hippie communities that made their home in Southern Oregon in the 1960s. Cannabis producers in those communities often had a production style that mixed spiritual, political, and cultural motivations for cannabis farming. Over time, that production style shifted towards a more economic focus as legalization expanded.
Legalization over time
1973
Oregon was the first state to decriminalize cannabis in 1973.
1998
Oregon legalizes medical marijuana.
2015
Oregon legalizes recreational adult-use cannabis.
2018
USDA hemp is legalized federally.
Josephine County has had strong cannabis growing communities in the illicit, medical, and now recreational markets. Now, cannabis producing communities in the county include a wide variety of farmers–including public land “trespass” producers, small-scale medical farmers, licensed and unlicensed cannabis growers, larger-scale hemp farmers, industrial mixed-light producers, and more. As cannabis production has shifted and expanded, so too have the main concerns and critiques about it. Initial public concerns centered on legality and morality of consumption, while the modern debate around outdoor cannabis farming in the West now focuses on associations with other criminal activity, and impacts on the environment from production practices ( Corva 2014 ).
Cannabis and the environment
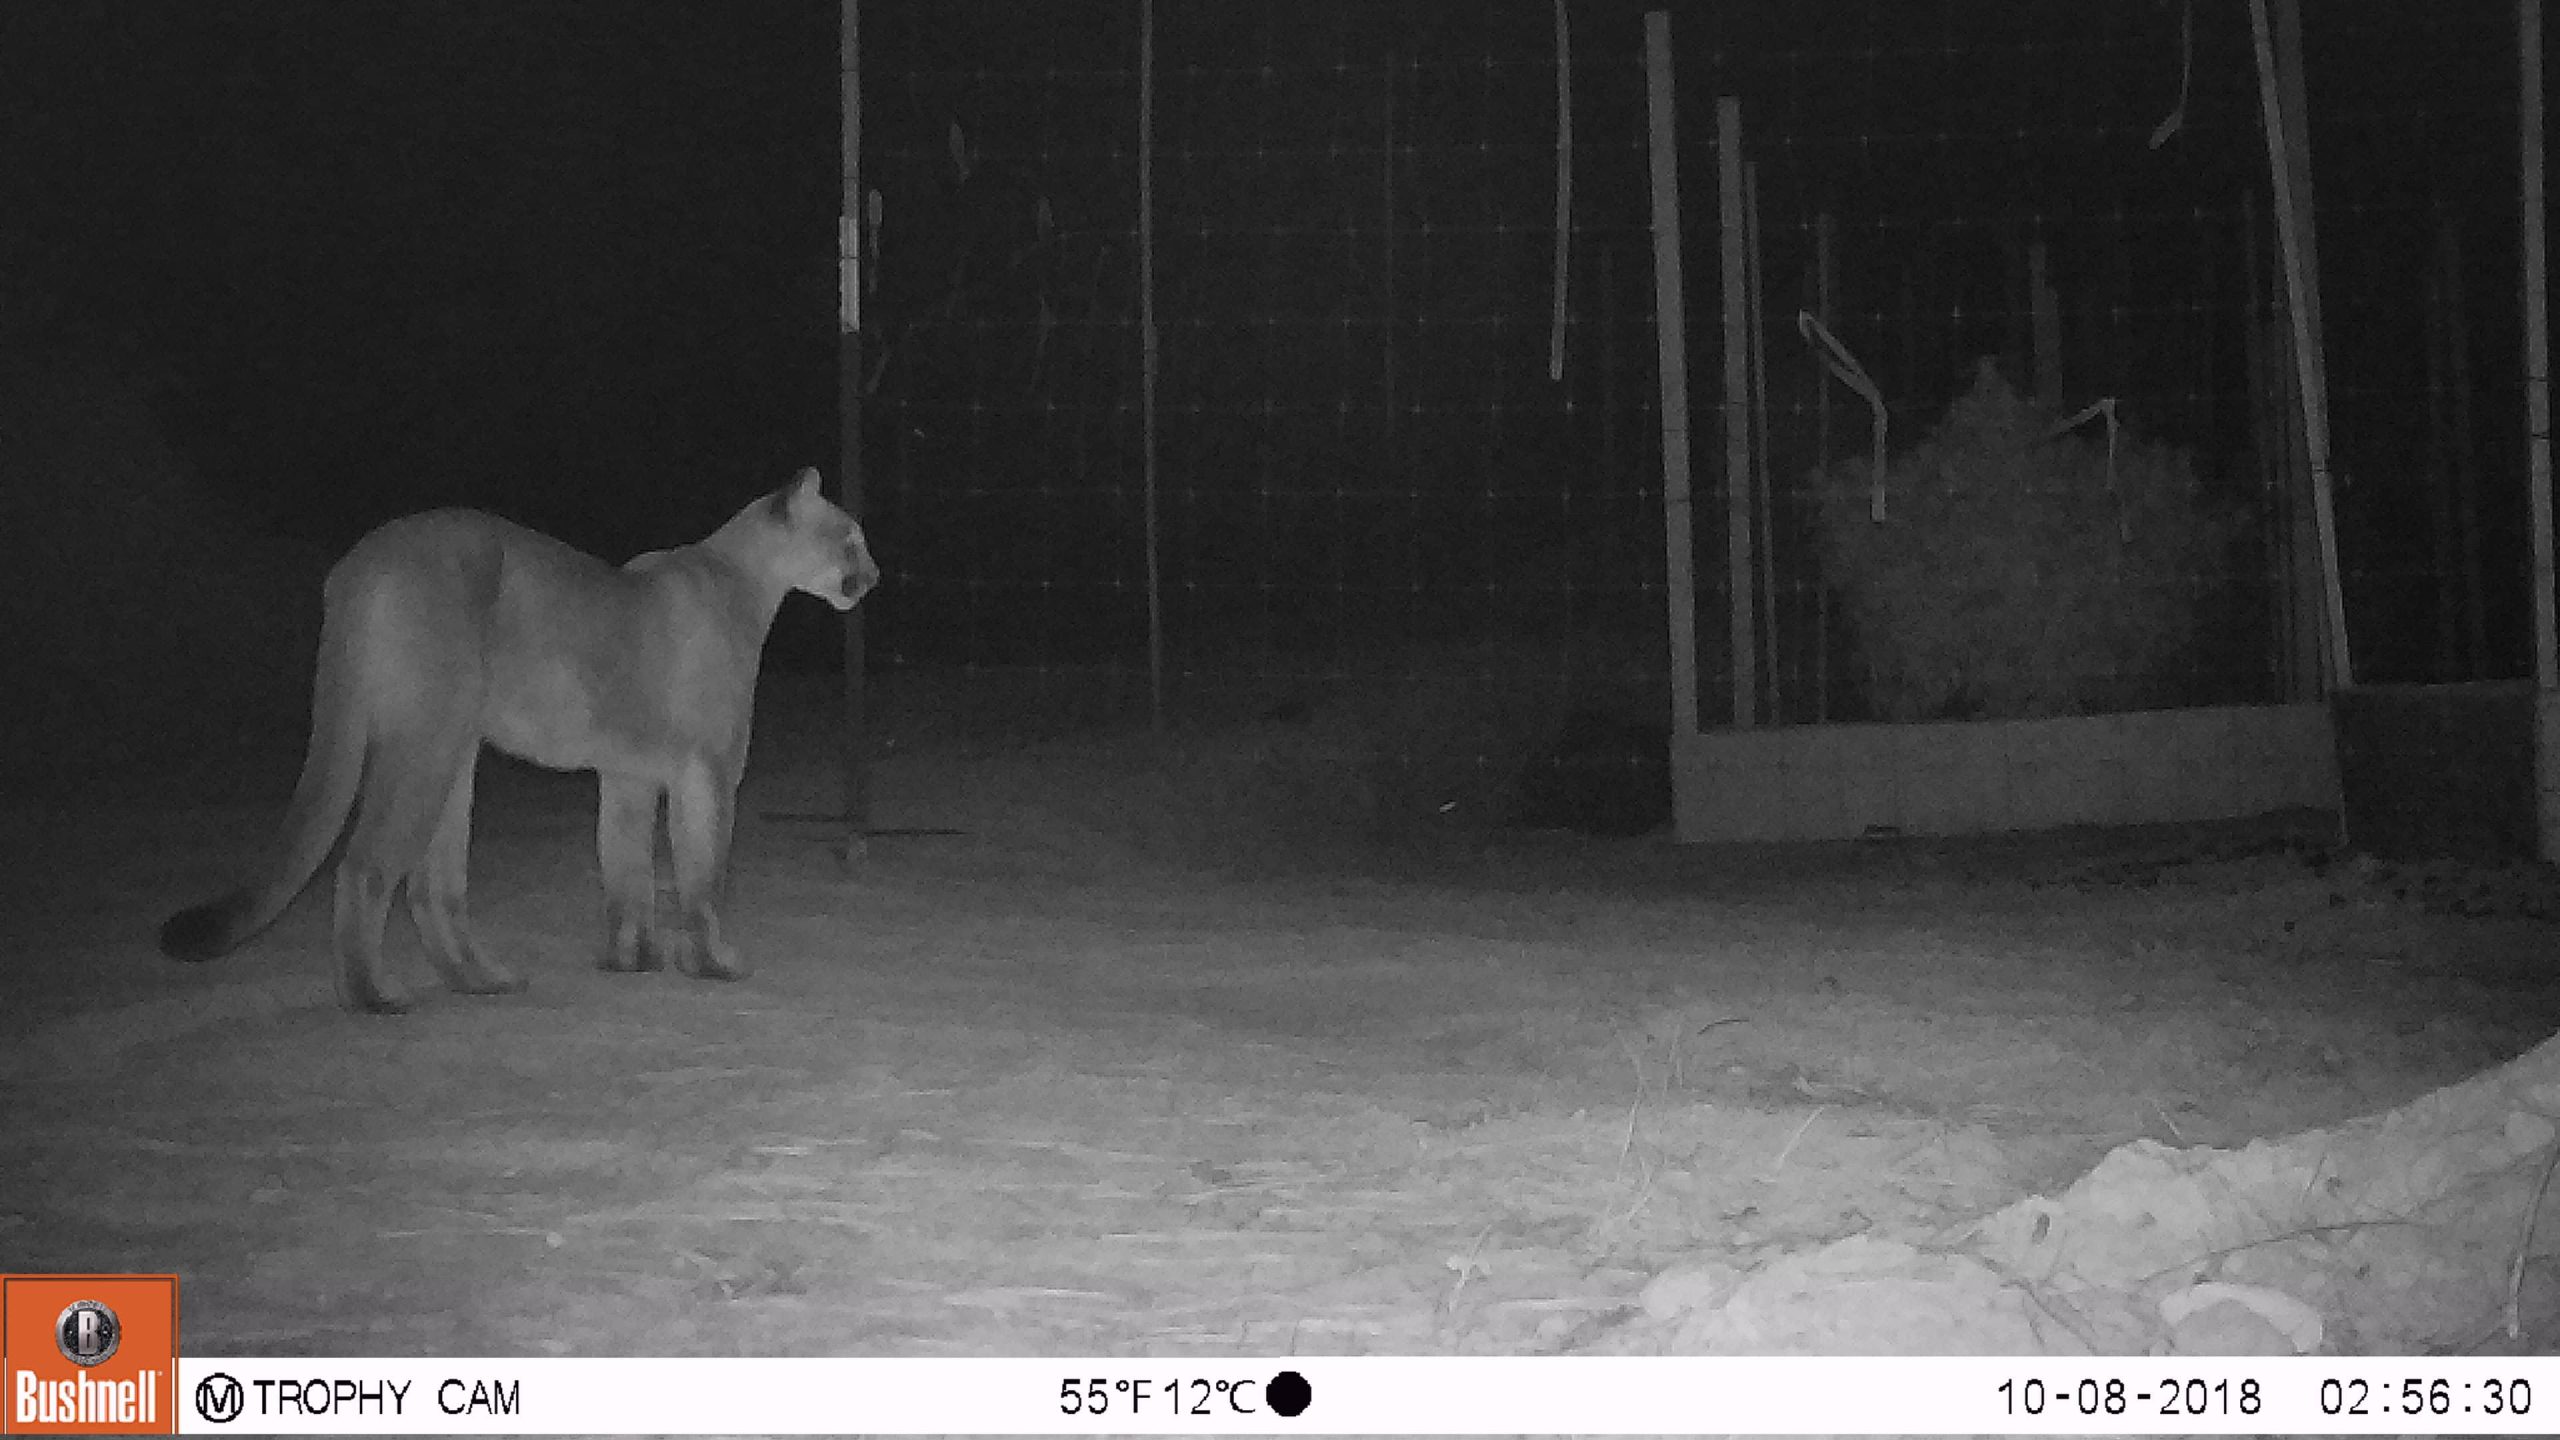
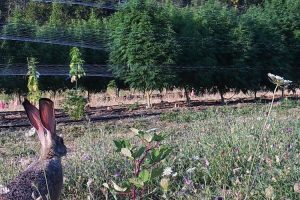
A Black-tailed Jackrabbit on East Fork Cultivars cannabis farm in Josephine County
Southern Oregon has long been a legacy production area for cannabis farming, but has also become a focal area for private-land recreational outdoor production in the state. For this mapping tool, we are focusing on private land production in Josephine County because of the local importance of the crop, as well as the rural location that has created increased opportunity for overlap of cannabis and sensitive environmental areas. Josephine County is part of the Klamath-Siskiyou ecoregion, one of the most biodiverse areas in the US, and home to many rare and endangered species, as well as multiple protected areas.
At the same time, Josephine County has a dominant cannabis industry. Josephine boasts the highest per capita growers licenses in the state (2019 OLCC grower license numbers). According to mapping data (see Methods), at least 6% of all private land parcels in the county have outdoor or greenhouse cannabis production occurring on them (>4 plants, unknown license status). The combination of a dominant cannabis industry with local biodiversity creates the potential for negative environmental impacts . While cannabis farming often employs sustainable land use practices (for example, Sun + Earth Certified , and existing regulation on pesticide use ), there are also documented practices associated with illegal cannabis farming that can cause direct and indirect harm to animals and their habitat (for example via poisoning , and other mechanisms ), as well as concerns about the impact of cannabis on water quality and availability . These potential impacts would likely be greater when cannabis is being grown more intensively or closer to freshwater resources and wildlife habitat. On the other hand, these impacts might be mitigated by management practices on site or relocation farther away from sensitive areas. It is therefore important for communities in Josephine County (or other cannabis producing regions) to consider the environmental, economic, and social tradeoffs of where cannabis is located.
Methods
The data and methods for our maps are based on the peer-reviewed publication entitled “The spatial overlap of small-scale cannabis farms with aquatic and terrestrial biodiversity,” published in December 2021 ( available to read for free here ).
Oregon was one of the first states in the US to legalize recreational marijuana in 2015, and this provides an opportunity to visualize the shift in private land cannabis production with legalization at an early time point. We are using 2016 imagery and data to capture the industry at its initial, post-legalization expansion. Note that this means that the maps are not current and do not include hemp, nor production occurring on public lands. However, research from Northern California suggests that cannabis production often in-fills in areas with existing cannabis farming , so the spatial distribution for cannabis on private lands is likely to be consistent over time without major policy or management intervention.
Note on the data
The cannabis data used for the following maps were collected as part of a research study . We used publicly available Google Earth satellite imagery for 2016 to map cannabis farms and greenhouses by hand. We counted the plants in outdoor gardens and estimated the number of plants in greenhouses (based on an average per area from 180 greenhouses where we could see through the roof to count plants). Each farm and greenhouse was given a confidence score to represent how likely it was to actually be cannabis, and only the highest confidence farms are used for our analyses.
This means that the maps and plant counts likely represent a conservative estimate of cannabis production. In addition, these maps are also likely an undercount of the overall cannabis production occurring in the county since they do not include indoor warehouse production or outdoor gardens that are intentionally obscured from aerial imagery, such as illegal production occurring on public lands. Finally, the mapped area encompasses only the cultivated canopy or greenhouse coverage, not the entire footprint of a cannabis farm.
The Maps
Here, we present an interactive tool to visualize the distribution of private-land cannabis farming in relation to land zoning, salmonid-bearing streams, and existing protected areas in Southern Oregon. The intent for these maps is to spark discussion on the importance of where cannabis is grown, and how different priorities may influence location preferences. Note that this approach is only a baseline and could be replicated using other variables, at different scales, or in other locations where cannabis is farmed outdoors.
In the following section we will illustrate factors that may be important to consider for environmental tradeoffs in relation to the distribution of cannabis production. The regions of overlap or proximity illustrated in these maps are places that may warrant further assessment or consideration, areas where more research might be needed, or locations that might become a focus for conversations around environmental best practices, enforcement, or policy restrictions.
Orienting to the map
First, let’s get oriented to the maps we will be using. For all of our cannabis analyses, we restricted our data summaries to private lands, and grouped results into 5 km 2 hexagons. So the baseline we are using looks like the map here. Please note that these maps are a web-based application and thus require a high bandwidth; if any of them aren’t loading for you, please try refreshing the page. You can expand the legend in the bottom left corner, zoom in and out using the plus and minus symbols, and drag the mouse to navigate.
Now that you’re oriented, keep scrolling to see the cannabis maps.
Cannabis
Cannabis production in Josephine County in 2016 was common across the county. Out of all private land parcels in the county, 5.8% contained a cannabis farm (over 2,200 individual parcels).
However, the distribution of cannabis was also clustered, with major hotspots in the Illinois Valley and Williams regions. 93.3% of the cannabis identified from aerial imagery was on private lands, and 66% was in outdoor gardens rather than greenhouses. The average size of cannabis farms was relatively small, at just 0.07 acres.
Cannabis in 2016 in Josephine County was experiencing a boom of production, with 64% of farms new since legalization.
With over 115,000 individual cannabis plants mapped, if each plant produced a pound of cannabis, based on OLCC’s $1,500 retail price per pound estimate from 2017 , this represents roughly $173 million. This is a very rough estimate since hard data are difficult to find for the cannabis industry given that much of this production likely occurred in the black market. However, when compared to the total market value of all other non-timber agriculture in the county, $18.8 million (2012 USDA Census of Agriculture), it is clear that the cannabis industry in Josephine County is a dominant force.
Zoning
Land use zones regulate the use and development of specific parcels of land. Each county in Oregon has its own zoning codes and regulations. This is an example of parcel zones from Cave Junction, Oregon.
In Josephine County, ever since recreational legalization, there has been a long term debate about which zones should be allowed for recreational cultivation and which should not. In particular, Residential zoned parcels and Farm Use parcels have become a predominant focus. Here we illustrate the predominant private land use zoning for cannabis in each region.
For this zoning map, we have grouped zoning codes into Farm (e.g. exclusive farm), Forest (e.g. woodlot resources), Residential, Industrial/Commercial, and Other (e.g. Serpentine) categories, based in part on the category groupings created by the County . Click on an individual cell for a summary of the number of private parcels of each zoning category, and the number of cannabis farms in each zone category. The popup also contains a graphical summary of these categories, and a list of which specific zoning codes are included in each group.
Cannabis in Josephine county in 2016 was predominantly grown on rural residential zoned parcels, followed by parcels zoned for forest products/timber management. Although few cannabis farms were located on parcels zoned for farming, it should be noted that the predominant zoning pattern for cannabis appears to follow the pattern of private parcels more generally.
Protected Areas
Cannabis production inside any public protected area is not legal, and likely would not be visible in our aerial imagery used to identify cannabis farms. However, there could also be potential concerns if cannabis development is concentrated close to existing protected areas, if it restricts the movement of animals to access habitats in those areas, or influences the animals living in those protected areas (for example from light or noise pollution).
Josephine County has many different federal, state, and private protected areas that provide varying levels of protection for wildlife habitat or landscape restoration. Combined, these protected areas actually cover a majority of the county (see inset protected area map). In turn, this means that most private land parcels are located relatively close to a protected area. Below, use the slider on the map to compare the distribution of all private land parcels (on the left) with those that have been identified to contain high-confidence cannabis (on the right) in relation to protected areas:
In the map above, the proximity of cannabis to all protected areas matches fairly closely with the proximity of private lands generally. However, not all protected areas are protected for the same reason, and many serve different social, economic, and environmental functions. So it can be useful to break down this comparison further.
First, protected areas are often categorized based on the types of activities that are or are not allowed. For example, the USGS uses a system called GAP that is based on how lands are managed. In Josephine County, there are fewer protected areas that are managed specifically for biodiversity conservation, but they are distributed across the entire county (see inset map). These protected areas in particular may provide important habitat for wildlife.
Below, use the slider to compare the distribution of all private land parcels (on the left) with those that have been identified to contain high-confidence cannabis (on the right) for their proximity to protected areas that are managed specifically for biodiversity conservation:
Again, cannabis seems to follow similar patterns to private lands generally, but this distinction begins to identify some differences. For instance, many of the regions in which private land is closest to protected areas are also areas where we did not detect any visible outdoor cannabis production.
Another useful category of protected areas are those owned by federal, state, and local government. Josephine County also has a large amount of land that is owned by different government agencies, particularly BLM land (see the inset map). BLM areas often have conservation management plans but also allow for resource extraction like timber harvesting.
Below, use the slider to compare the distribution of all private land parcels (on the left) with those that have been identified to contain high-confidence cannabis (on the right) for their proximity to protected areas that are government-owned:
Yet again, it appears as though many of the private parcels closest to protected public lands did not contain visible, high-confidence cannabis farms. However, these maps do identify regions in the north and the southwest of the county in which cannabis was located closer to protected areas than other cultivating regions.
Salmon Habitat
Josephine County supports a high diversity of fish species. Coho salmon (Scientific name Oncorhynchus kisutch) in particular are a federally threatened species and spawn in small upstream tributaries that are susceptible to drought.
A high density of cannabis close to Coho habitat could be a concern if water withdrawals lead to dewatering of streams, or if fertilizers run off into fish habitat. Licensed recreational cannabis must conform to state and county regulations on water use and erosion control that may reduce these potential impacts.
Use the slider on the map below to compare all private parcels (on the left) with cannabis farms (on the right) based on their proximity to Coho Salmon habitat.
In contrast to the protected area comparisons where many of the private parcels closest to protected areas did not contain visible, high-confidence cannabis farms, in this case, many of the private parcels closest to Coho salmon did contain a detected cannabis farm.
Freshwater
Water is a valuable resource for both wildlife and people, even in regions that are not specifically identified as fish habitat. Proximity of cannabis to any freshwater source is important to understand because of potential impacts on general water availability during summer drought. While many cannabis farmers collect and store water from the wintertime and avoid drawing water in the summer, many do not have the necessary storage to forebear during summer months . Therefore, proximity of cannabis to freshwater, particularly rivers and streams, is an important baseline to understand where water shortages may occur if proper water storage is not achieved.
Use the slider on the map below to compare all private parcels (on the left) with cannabis farms (on the right) based on their proximity to freshwater rivers, streams, and ponds.
Many private parcels in the county are already located close to freshwater, and cannabis follows the same pattern. In analyses of the 2016 data , cannabis farms appeared to be slightly closer to rivers and streams than private land generally, and were also located close to smaller headwater streams.
How might these data change over time?
The cannabis data used for the majority of the maps presented here are from 2016 Google Earth images…
However, there is newer cannabis imagery available for the Illinois Valley in 2021, provided by the Illinois Valley Soil and Water Conservation District and Josephine County GIS Services ( Hall 2021 ).While these data are in a different format from the methods listed here, and are therefore not directly comparable, they do provide an indication that most clusters of cannabis production in 2016 were maintained and expanded into 2021.
Summary and Conclusion
Cannabis agriculture in Josephine County in 2016 was pervasive across the county despite small individual farm size and overall area (a total of 331 cultivated acres of high-confidence cannabis across the entire county). Cannabis generally followed patterns established by existing private land distributions (for example, in terms of its spatial relationships to zoning and protected areas), but was also located close to Coho salmon habitat and freshwater rivers and streams. Additional analyses indicated that cannabis was also located within potential Pacific fisher range (Pekania pennanti) and in forested vegetation.
The maps presented here provide a baseline understanding of cannabis distributions and relation to sensitive ecological features. It is important to remember that these data have limitations (see Methods above) and do not directly measure environmental impact. Instead, these are intended to spark dialog and community discussions about the benefits, risks, and tradeoffs of where and how cannabis agriculture occurs. Please take your time exploring these maps and feel free to reach out and share your own conclusions.
About/Contact
If you have any questions, concerns, or comments about the map or its underlying data, please use the following google form. When sharing this story map, please use the link from the Cannabis Research Webpage: https://crc.berkeleydev.pendari.com/josphine-oregon/, however, if you wish the view the map full screen you can also use the direct link: https://arcg.is/1r5SGj0.
This story map was created by the following people: Phoebe Parker-Shames and Christopher Choi, with consultation from Jamie Trammel and Aaron Howard.
Data for this paper comes from the peer-reviewed publication, “The spatial overlap of small-scale cannabis farms with aquatic and terrestrial biodiversity.” Cannabis farmer quotes come from a series of anonymous interviews conducted by Phoebe Parker-Shames in 2019 in accordance with human subjects review.
Acknowledgments
We would like to thank the co-authors on the original publication that provided the backbone for this storymap: Phoebe Parker-Shames, Christopher Choi, Van Butsic, David Green, Brent Barry, Katie Moriarty, Taal Levi, and Justin Brashares. We thank the undergraduate research assistants from UC Berkeley who helped map cannabis farms: Anna Mazur, Frances Bingham, Jamie German, Augie Clements, Parker Bohls, Liam Jameson, Katrina Gonzales, Jordan Pulaski, Ellie Resendiz, Michael Xiao, and Alice Hua. Thanks to the Geospatial Innovation Facility at UC Berkeley for providing computing space for undergraduate assistants. Thank you to the Cannabis Research Center at Berkeley , and the Brashares Lab for providing feedback on this story map. Thank you to Gabe Gowell for assisting with layer exploration for this project. Thank you to Chris Hall for sharing his 2021 aerial cannabis data from the Illinois Valley. A huge thank you to Bob Noyes with Josephine County GIS for helping us with technical support to host the data layers for this map so that they may be publicly accessible.
We acknowledge and affirm that our study area for these cannabis maps is the ancestral land of the Cow Creek Umpqua, Tolowa Dee-ni`, Takelma, Karuk, and other Confederated Tribes of the Grand Ronde ( https://native-land.ca/ ).